
ClearlyIP’s Tips and Tricks
Live Debugging with SNGREP
When it comes to debugging SIP messages, many of us like to do it in realtime. It help us have a full picture of what is going on, instead of retrieving PCAPS and logs, review, reproduce, modify, test, retrieve logs again and again, and for those who would like to try a new debugging tool, SNGREP is the solution.
SNGREP, as stated in their wiki[1] is “is a terminal tool that groups SIP (Session Initiation Protocol) Messages by Call-Id, and displays them in arrow flows similar to the used in SIP RFCs.” This command line tool can capture SIP packets in real time, read and save PCAP files. It supports UDP, TCP and TLS transports. To install it just follow the steps described in the wiki.
To use SNGREP, you can execute the command in the Linux Command Line:
sngrep.
The main screen shows the following columns:
- Idx: Line number.
- Method: Type of SIP message.
- SIP From: SIP message “From”.
- SIP To: SIP message “To”.
- Msgs: Amount of messages.
- Source: Source IP and port.
- Destination: Destination IP and port.
- Call State: Call identifier.
At the bottom of the main screen the following options are shown:
- ESC Quit: Terminate SNGREP.
- Enter: Shows more information about the highlighted line.
- Space: A user can select multiple lines and can be used with the F2 Save option.
- F1 Help: Shows the help menu.
- F2 Save: Saves the current capture session to a .pcap or .txt file to a specific path and file name.
- F3 Search: Searching options.
- F4 Extended: Extended view.
- F5 Clear: Clears the screen.
- F7 Filter: Like Search but with more options about SIP protocol.
- F8 Settings: Shows the settings interface, capture options, call flow options, and EEP/HEP Homer options.
- F10: Displays what columns will be displayed on the main window.
If there’s any SIP flow captured by SNGREP, it will appear in the main screen. Just use the keyboard’s arrows keys and select the desired SIP message you would like to review using the Enter key.
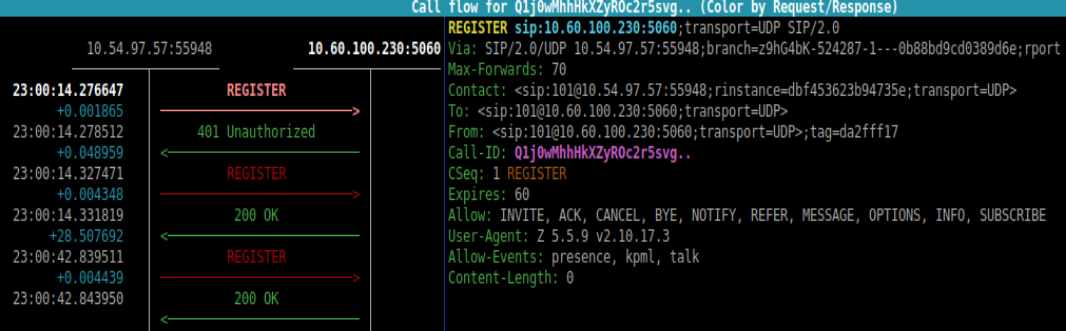
One amazing feature of SNGREP is that it will update the SIP messages and call flow from the selected message.
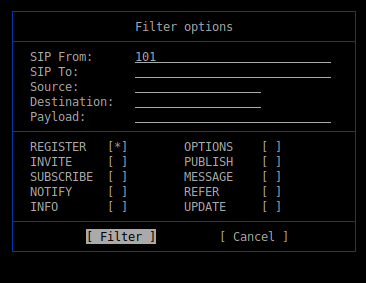
The following example will show how we can catch the registration attempts from extension 101 to our PBX. By pressing F7 the filter options will be shown and we will enter 101 in the “SIP from” field and select the REGISTER method as shown below.
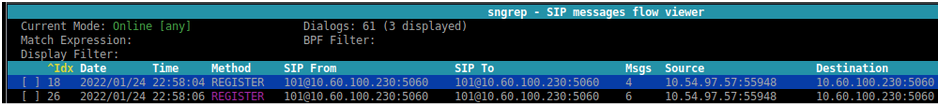
If we press Enter on the selected line, we will see all the registration attempts in real time with all the SIP messages involved.
If we want to check ‘RTP’ on a live call we need to open the INVITE message with Enter and then press F3.
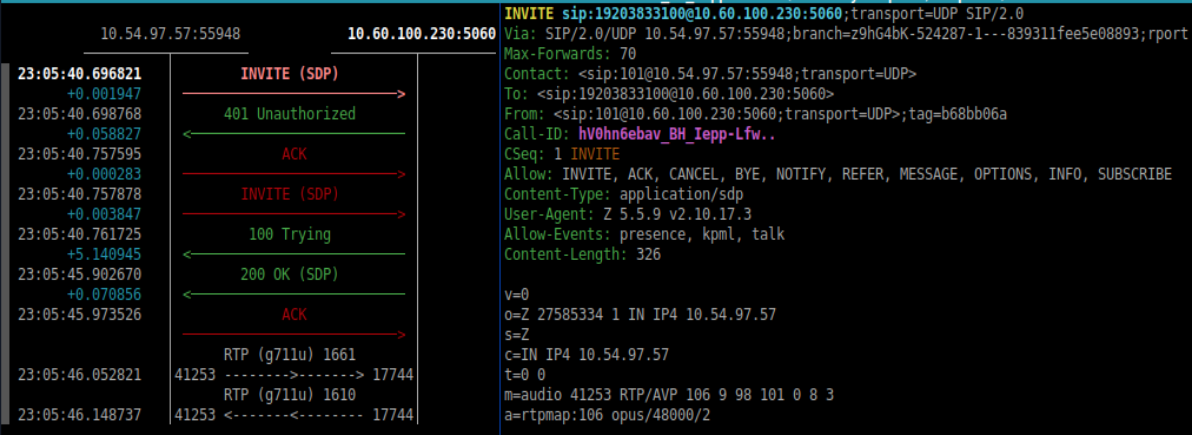
F2 is for ‘SDP’ and F3 for ‘RTP’.
As you can see, SNGREP offers a variety of options helpful in our daily SIP debugging.
[1] https://github.com/irontec/sngrep/wiki